这是一篇prometheus单独监控单服务的部署方法,其中涉及的插件基本都是使用docker进行安装。
安装docker-ce # 安装docker
1
2
3
4
5
6
yum install -y yum-utils device-mapper-persistent-data lvm2 yum-config-manager \ --add-repo \ https://download.docker.com/linux/centos/docker-ce.repo yum makecache fast yum install -y docker-ce
# 编辑systemctl的Docker启动文件
1 sed -i "13i ExecStartPost=/usr/sbin/iptables -P FORWARD ACCEPT" /usr/lib/systemd/system/docker.service
# 启动docker
1
2
3
systemctl daemon-reload systemctl enable docker systemctl start docker
Prometheus安装9090 物理机安装 这里是基于1.6版本进行安装 下载地址
1 wget https://github.com/prometheus/prometheus/releases/download/v1.6.2/prometheus-1.6.2.linux-amd64.tar.gz
使用 tar 解压缩 prometheus-1.6.2.linux-amd64.tar.gz
1
2
tar -xvzf ~/Download/prometheus-1.6.2.linux-amd64.tar.gz cd prometheus-1.6.2.linux-amd64
当解压缩成功后,可以运行 version 检查运行环境是否正常
如果你看到类似输出,表示你已安装成功:
1
2
3
4
5
6
7
8
prometheus, version 1.6.2 (branch: master, revision: b38e977fd8cc2a0d13f47e7f0e17b82d1a908a9a) build user: root\@c99d9d650cf4 build date: 20170511-12:59:13 go version: go1.8.1
2.5版本下载地址https://github.com/prometheus/prometheus/releases/download/v2.5.0/prometheus-2.5.0.linux-amd64.tar.gz
启动 Prometheus Server 如果 prometheus 正常启动,你将看到如下信息:
1
2
3
4
5
6
7
8
9
10
11
12
13
14
15
INFO[0000] Starting prometheus (version=1.6.2, branch=master, revision=b38e977fd8cc2a0d13f47e7f0e17b82d1a908a9a) source=main.go:88 INFO[0000] Build context (go=go1.8.1, user=root\@c99d9d650cf4, date=20170511-12:59:13) source=main.go:89 INFO[0000] Loading configuration file prometheus.yml source=main.go:251 INFO[0000] Loading series map and head chunks... source=storage.go:421 INFO[0000] 0 series loaded. source=storage.go:432 INFO[0000] Starting target manager... source=targetmanager.go:61 INFO[0000] Listening on :9090 source=web.go:259
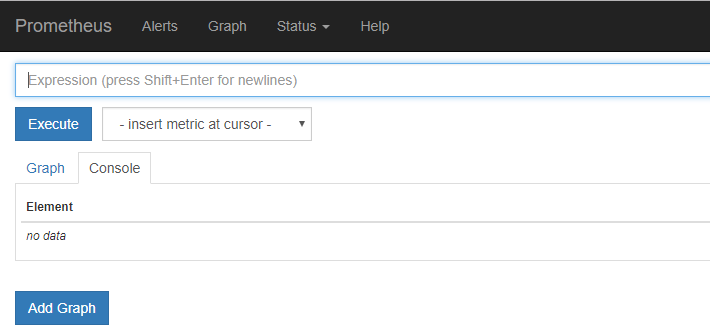
从上述启动方式来看,我们可以用screen或者&方式后台运行启动http://IP:9090 ,将看到如下页面
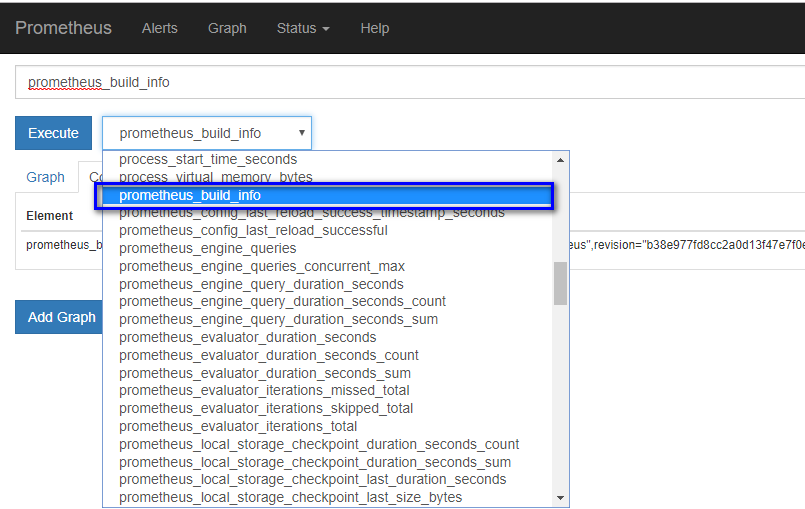
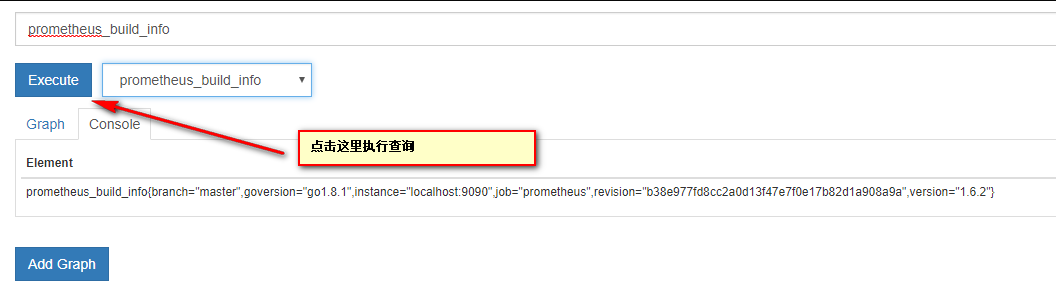
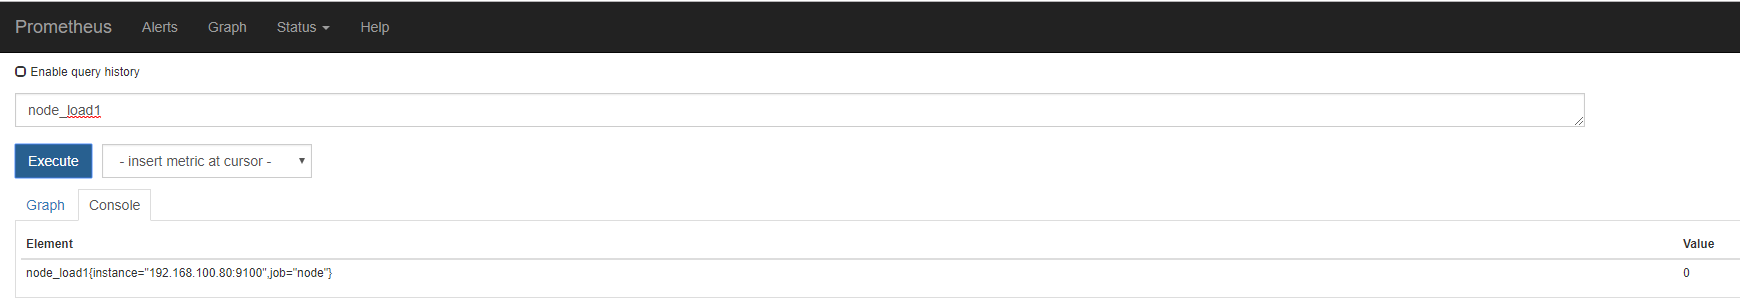
在默认配置中,我们已经添加了 Prometheus Server 的监控,所以我们现在可以使用 PromQL (Prometheus Query Language)来查看,比如
总结:
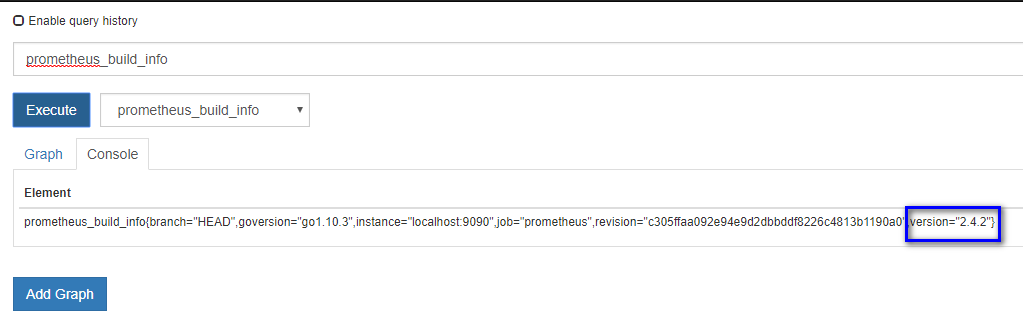
容器化安装 1 2 3 4 5 6 docker run -d \--restart=always \ -p 9090:9090 \ --name prometheus \ -v /root/prometheus:/etc/prometheus \ quay.io/prometheus/prometheus \ --config.file=/etc/prometheus/prometheus.yml --web.enable-lifecycle
这时候我们再次查询版本就是最新版
Prometheus服务重载 Prometheus一般更新服务都是重启,这不适合生产环境,所以需要重载配置文件
1 curl -X POST <http://IP/-/reload>
从 2.0 开始,hot reload 功能是默认关闭的,如需开启,需要在启动 Prometheus
1 curl -X POST http://192.168.100.80:9090/-/reload
Prometheus服务修改存储位置
--storage.tsdb.path:这决定了Prometheus写入数据库的位置。默认为data/。镜像中定义的是/prometheus/data
--storage.tsdb.retention:这决定了何时删除旧数据。默认为15d。
1 2 3 4 5 6 7 8 docker run -d --restart=always \ -p 9090:9090 \ --name prometheus \ -v /root/prometheus:/etc/prometheus:rw \ -v /root/prometheus/data:/etc/prometheus/data \ quay.io/prometheus/prometheus \ --config.file=/etc/prometheus/prometheus.yml --web.enable-lifecycle \ --storage.tsdb.path=/etc/prometheus/data --storage.tsdb.retention=15d
Grafana安装3000 物理机安装 1 2 wget https://s3-us-west-2.amazonaws.com/grafana-releases/release/grafana-5.2.4-1.x86_64.rpm sudo yum localinstall grafana-5.2.4-1.x86_64.rpm
容器化安装 1 docker run --restart=always -dit -v /etc/localtime:/etc/localtime --name=grafana -p 3000:3000 grafana/grafana
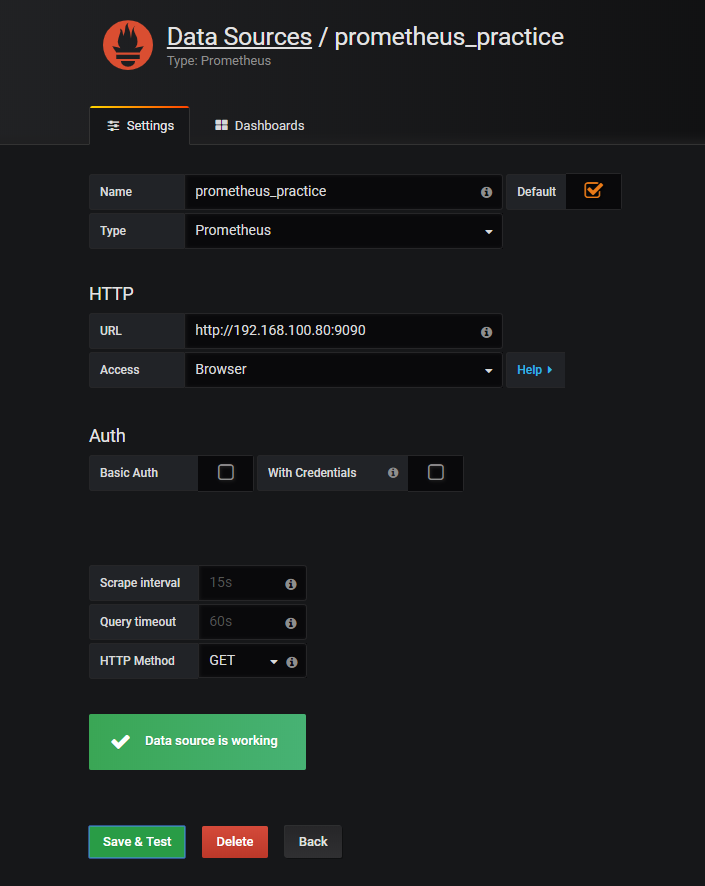
连接prometheus 没有开启prometheus的认证,这里采用代理方式,即浏览器方式,注意URL地址有http://,如果不能访问在切换到default的方式尝试下。
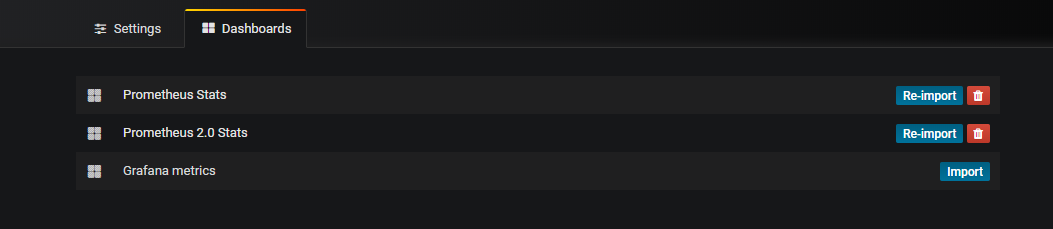
添加dashboard模板
Node Exporter安装9100 node_exporter 主要用于 UNIX 系统监控
物理机安装 下载地址
1 wget https://github.com/prometheus/node_exporter/releases/download/v0.14.0/node_exporter-0.14.0.linux-amd64.tar.gz
解压
1 tar zxf node_exporter-0.14.0.linux-amd64.tar.gz
进入后运行
访问http://192.168.100.80:9100/metrics即可看到时序数据。
容器化安装 老命令是这样
1 2 3 4 5 6 7 8 9 docker run -d \ -v /proc:/host/proc:ro \ -v /sys:/host/sys:ro \ -v /:/rootfs:ro \\ --net="host" \ quay.io/prometheus/node-exporter \ --collector.procfs /host/proc \ --collector.sysfs /host/sys \ --collector.filesystem.ignored-mount-points "^/(sys\|proc\|dev\|host\|etc)($\|/)"
新命令
1 2 3 4 5 6 7 8 docker run -d --name=node-exporter --restart=always \ -v "/proc:/host/proc" \ -v "/sys:/host/sys" \ -v "/:/rootfs" \ --net="host" quay.io/prometheus/node-exporter \ --path.procfs /host/proc \ --path.sysfs /host/sys \ --collector.filesystem.ignored-mount-points "^/(sys|proc|dev|host|etc)($|/)"
读取node数据
在prometheus.yml文件中新加
1 2 3 - job_name: " node-exporter" static_configs: - targets: ["127.0.0.1:9100"]
查询promQL
Grafana模板添加地址 https://grafana.com/dashboards/5573
上面地址中json下载后导入到grafana的dashboard中即可
Mysql exporter安装9104 容器化安装 1 2 3 4 5 docker run -d --restart=always \ -p 9104:9104 \ --name mysqld-exporter \ -v /root/prometheus/mysqld:/etc/mysqld \ prom/mysqld-exporter --config.my-cnf="/etc/mysqld/my.cnf"
my.cnf
1 2 3 4 5 6 [client] user=root password=数据库密码 host=服务器所在地址 port=3306
参考地址https://github.com/prometheus/mysqld_exporter/blob/master/mysqld_exporter_test.go
在prometheus.yml文件中新加
1 2 3 4 - job_name: "mysql" static_configs: - targets: ["127.0.0.1:9104"]
Grafana模板添加地址 https://grafana.com/dashboards/6239
上面地址中json下载后导入到grafana的dashboard中即可
Nginx exporter安装9913 容器化安装 1 2 3 4 docker run -d --restart=always \ --name nginx-exporter -p 9913:9913 \ --env NGINX_STATUS="http://127.0.0.1/status/format/json" \ sophos/nginx-vts-exporter
在prometheus.yml文件中新加
1 2 3 4 - job_name: "nginx" static_configs: - targets: ["127.0.0.1:9913"]
修改nginx配置 一.nginx添加vts模块(重新编译后进行安装)
下载模块
1 git clone git://github.com/vozlt/nginx-module-vts.git
在nginx编译时添加vts模块
编译并安装nginx安装包解压后路径下,此处$PWD是因为我的vts模块git到了nginx包路径下
1 ./configure --prefix=/software/nginx --add-module=$PWD/nginx-module-vts && make && make install
二.Nginx Conf配置
更改Nginx Conf的配置,添加监控接口/status/:
1 2 3 4 5 6 7 8 9 10 11 12 13 14 http { vhost_traffic_status_zone; vhost_traffic_status_filter_by_host on; ... server { ... location /status { vhost_traffic_status_display; vhost_traffic_status_display_format html; } } }
配置建议:
打开vhost过滤:
1 vhost_traffic_status_filter_by_host on;
开启此功能,在Nginx配置有多个server_name的情况下,会根据不同的server_name进行流量的统计,否则默认会把流量全部计算到第一个server_name上。
在不想统计流量的server区域禁用vhost_traffic_status,配置示例:
1 2 3 4 5 server { ... vhost_traffic_status off; ... }
假如nginx没有规范配置server_name或者无需进行监控的server上,那么建议在此vhost上禁用统计监控功能。否则会出现“127.0.0.1”,hostname等的域名监控信息。
重启nginx,不是重载
Grafana模板添加地址 https://grafana.com/dashboards/2949
上面地址中json下载后导入到grafana的dashboard中即可
Redis exporter安装9121 容器化安装 1 docker run -d --name redis-exporter -p 9121:9121 --env REDIS_ADDR="192.168.3.144:6379" oliver006/redis_exporter
环境变量
名称
描述
REDIS_ADDR
Redis节点的地址
REDIS_PASSWORD
验证Redis时使用的密码
REDIS_ALIAS
Redis节点的别名
REDIS_FILE
包含Redis节点的文件路径
在prometheus.yml文件中新加
1 2 3 - job_name: "redis" static_configs: - targets: ["127.0.0.1:9121"]
Grafana模板添加地址 https://grafana.com/dashboards/763
上面地址中json下载后导入到grafana的dashboard中即可
SpringBoot2.x监控 监控java项目的jvm、缓冲区等
修改java代码,使其可以生成时序数据
参考链接地址
https://blog.csdn.net/MyHerux/article/details/80667524?tdsourcetag=s_pcqq_aiomsg
在prometheus.yml文件中新加
1 2 3 4 5 6 - job_name: "webhook" metrics_path: '可访问的时序数据路径' static_configs: - targets: ["项目地址"] labels: instance: 项目名
Grafana模板添加地址 https://grafana.com/dashboards/6756
Pushgateway安装 Pushgateway 是 Prometheus 生态中一个重要工具,使用它的原因主要是:
Prometheus 采用 pull 模式,可能由于不在一个子网或者防火墙原因,导致Prometheus 无法直接拉取各个 target 数据。
在监控业务数据的时候,需要将不同数据汇总, 由 Prometheus统一收集。
将多个节点数据汇总到 pushgateway, 如果 pushgateway 挂了,受影响比多个 target大。
Prometheus 拉取状态 up 只针对 pushgateway, 无法做到对每个节点有效。
Pushgateway 可以持久化推送给它的所有监控数据。
物理机安装 下载地址
1 wget https://github.com/prometheus/pushgateway/releases/download/v0.4.0/pushgateway-0.4.0.linux-amd64.tar.gz
和其他服务一样,也是解压后运行服务即可
容器化安装 1 docker run -d --restart=always --name=pushgateway -p 9091:9091 prom/pushgateway
Alertmanager安装9093 物理机安装 下载地址
1 wget https://github.com/prometheus/alertmanager/releases/download/v0.14.0/alertmanager-0.14.0.linux-amd64.tar.gz
解压后创建配置文件
alertmanager.yml
1 2 3 4 5 6 7 8 9 10 11 12 13 14 15 global: resolve_timeout: 2h route: group_by: ['alertname'] group_wait: 5s group_interval: 10s repeat_interval: 1h receiver: 'webhook' receivers: - name: 'webhook' webhook_configs: - url: 'http://example.com/xxxx' send_resolved: true
说明: 这里我们使用 Alertmanager 的 webhook_configs选项来接收消息,当接收到新的告警信息,它会将消息转发到配置的 url地址。
容器化安装 1 2 3 docker run -d --restart=always -p 9093:9093 --name=alertmanager \ -v /root/prometheus/alertmanager:/etc/alertmanager \ quay.io/prometheus/alertmanager --config.file=/etc/alertmanager/alertmanager.yml
配置QQ邮件报警1.6版本 Prometheus 版本:prometheus-1.6
修改 alertmanager.yml 配置文件 1 2 3 4 5 6 7 8 9 10 11 12 13 14 global: smtp_smarthost: 'smtp.qq.com:587' smtp_from: '发件人邮箱' // xxx@qq.com smtp_auth_username: '发件人邮箱' //xxx@qq.com smtp_auth_password: 'QQ邮箱授权码' //QQ邮箱设置中心生成 route: repeat_interval: 10s receiver: '收件人信息' // xxxX receivers: - name: '收件人信息' // xxxX email_configs: - to: '收件人邮箱' // xxxX@qq.com
在prometheus下添加 alert.rules 文件 alert.rules
1 2 3 4 5 6 7 8 ALERT memory_high IF prometheus_local_storage_memory_series >= 0 FOR 15s ANNOTATIONS { summary = "Prometheus using more memory than it should {{ $labels.instance }}", description = "{{ $labels.instance }} has lots of memory man (current value: {{ $value }}s)", }
修改prometheus.yml新加配置 1 2 3 4 5 rule_files: # - "first.rules" # - "second.rules" - "alert.rules"
重启两个服务
1 2 ./alertmanager -config.file=simple.yml ./prometheus -alertmanager.url=http://localhost:9093
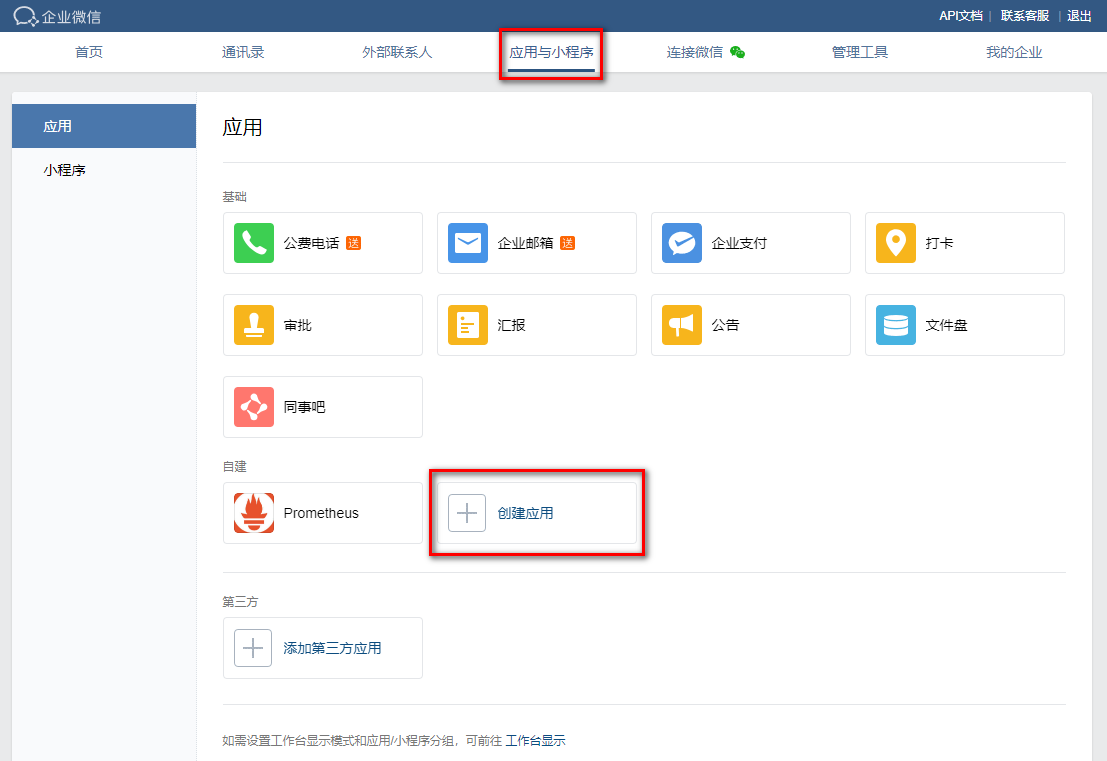
企业微信报警2.0版本
prometheus: 2.0
至此,所有服务插件使用容器化安装!!!
修改prometheus.yml配置文件 1 2 3 4 5 6 7 8 9 10 11 12 13 14 15 16 17 18 19 20 21 22 global: scrape_interval: 15s # Set the scrape interval to every 15 seconds. Default is every 1 minute. evaluation_interval: 15s # Evaluate rules every 15 seconds. The default is every 1 minute. scrape_configs: - job_name: 'prometheus' static_configs: - targets: ['localhost:9090'] - job_name: "node" static_configs: - targets: ["192.168.100.80:9100"] # Alertmanager configuration alerting: alertmanagers: - static_configs: - targets: - 192.168.100.80:9093 rule_files: - "/etc/prometheus/rules.yml"
修改alertmanager.yml配置文件 1 2 3 4 5 6 7 8 9 10 11 12 13 14 15 16 17 global: resolve_timeout: 1h route: group_by: ['alertname'] receiver: 'wechat' group_wait: 30s group_interval: 30s repeat_interval: 10m receivers: - name: 'wechat' wechat_configs: - corp_id: 'xxx' to_party: '8' agent_id: '1000009' api_secret: 'xxx'
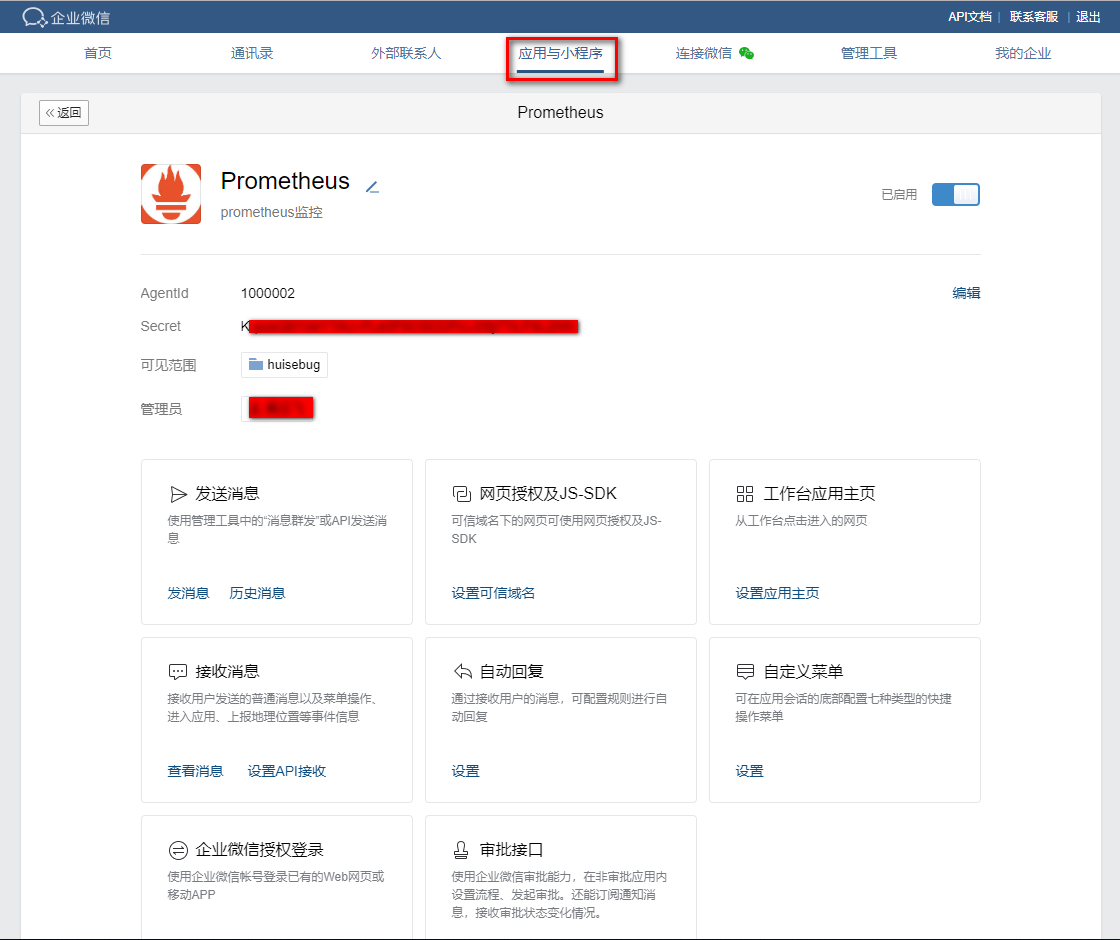
corp_id: 企业微信账号唯一 ID, 可以在”我的企业”中查看。
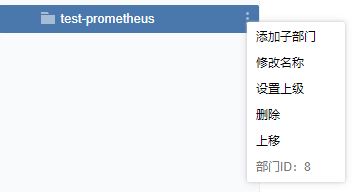
to_party: 需要发送的组(部门ID)。即
agent_id: 第三方企业应用的 ID,可以在自己创建的第三方企业应用详情页面查看。
api_secret:第三方企业应用的密钥,可以在自己创建的第三方企业应用详情页面查看。
在prometheus文件夹下添加 rules.yml 文件 rules.yml
1 2 3 4 5 6 7 8 groups: - name: node rules: - alert: Server_Status expr: up{job="node"} == 0 for: 15s annotations: summary: "机器 {{ $labels.instance }} 挂了"
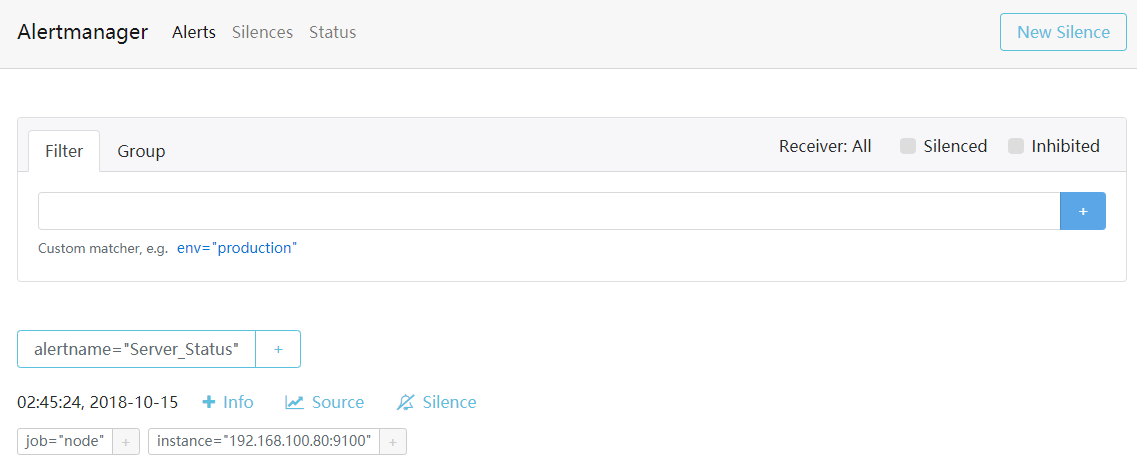
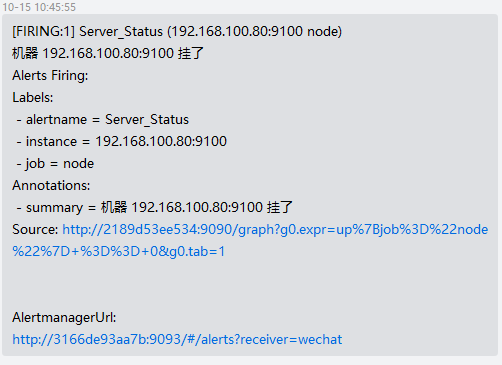
然后重启prometheus和alertmanager容器,再关闭node-exporter容器,即可在企业微信接收到报警信息
也可不断刷新alertmanager的web页面http://192.168.100.80:9093/\#/alerts进行查看
企业微信接收到的报警信息
企业微信/QQmail同时报警 配置文件如下
1 2 3 4 5 6 7 8 9 10 11 12 13 14 15 16 17 18 19 20 21 22 23 24 25 26 27 28 29 30 31 32 33 34 global: resolve_timeout: 1h smtp_smarthost: 'smtp.qq.com:587' smtp_from: '发件人' smtp_auth_username: '发件人' smtp_auth_password: '授权码' route: group_by: ['alertname'] group_wait: 30s group_interval: 30s repeat_interval: 10m receiver: 'huisebug' routes: - receiver: 'wechat' continue: true - receiver: 'huisebug' continue: true receivers: - name: 'huisebug' email_configs: - to: '收件人' send_resolved: true - name: 'wechat' wechat_configs: - corp_id: '' to_party: '8' agent_id: '1000009' api_secret: '' send_resolved: true templates: - '/etc/alertmanager/configmaps/alertmanager-temp/temp.yaml'
钉钉webhook报警2.0版本8060 安装钉钉插件 物理机安装 1 wget https://github.com/timonwong/prometheus-webhook-dingtalk/releases/download/v0.3.0/prometheus-webhook-dingtalk-0.3.0.linux-amd64.tar.gz
解压并启动
1 2 3 nohup ./prometheus-webhook-dingtalk \ --ding.profile="ops_dingding=钉钉机器人处复制webhook" \ 2> &1 1>dingding.log &
容器化安装 1 2 docker run -d --restart=always -p 8060:8060 --name=prometheus-webhook-dingtalk timonwong/prometheus-webhook-dingtalk \ --ding.profile="ops_dingding=钉钉机器人处复制webhook"
修改alertmanager.yml
1 2 3 4 5 6 7 8 9 10 11 12 13 14 15 16 17 18 19 global: resolve_timeout: 5s route: receiver: webhook group_wait: 30s group_interval: 5s repeat_interval: 90s group_by: [alertname] routes: - receiver: webhook group_wait: 10s match: team: node receivers: - name: webhook webhook_configs: - url: http://192.168.3.144:8060/dingtalk/ops_dingding/send send_resolved: true
Prometheus-server的读写分离 建立三个文件夹prometheus1(读) prometheus2(写) prometheus3(写)
读 prometheus.yml
1 2 3 4 5 6 7 8 9 global: scrape_interval: 15s # Set the scrape interval to every 15 seconds. Default is every 1 minute. evaluation_interval: 15s # Evaluate rules every 15 seconds. The default is every 1 minute. remote_read: - url: 'http://192.168.100.80:9191/api/v1/read' remote_timeout: 8s - url: 'http://192.168.100.80:9192/api/v1/read' remote_timeout: 8s
写 prometheus.yml 两个相同
1 2 3 4 5 6 7 8 9 10 11 global: scrape_interval: 15s # Set the scrape interval to every 15 seconds. Default is every 1 minute. evaluation_interval: 15s # Evaluate rules every 15 seconds. The default is every 1 minute. scrape_configs: - job_name: 'prometheus' static_configs: - targets: ['localhost:9090'] - job_name: "node" static_configs: - targets: ["192.168.100.80:9100"]
容器化建立三个服务
1 2 3 4 5 6 7 8 9 10 11 12 13 14 15 16 17 18 19 20 docker run -d --restart=always \ -p 9190:9090 \ --name prometheus-read \ -v /root/prometheus/prometheus1:/etc/prometheus \ quay.io/prometheus/prometheus \ --config.file=/etc/prometheus/prometheus.yml --web.enable-lifecycle docker run -d --restart=always \ -p 9191:9090 \ --name prometheus-write-1 \ -v /root/prometheus/prometheus2:/etc/prometheus \ quay.io/prometheus/prometheus \ --config.file=/etc/prometheus/prometheus.yml --web.enable-lifecycle docker run -d --restart=always \\ -p 9192:9090 \ --name prometheus-write-2 \ -v /root/prometheus/prometheus3:/etc/prometheus \ quay.io/prometheus/prometheus --config.file=/etc/prometheus/prometheus.yml --web.enable-lifecycle
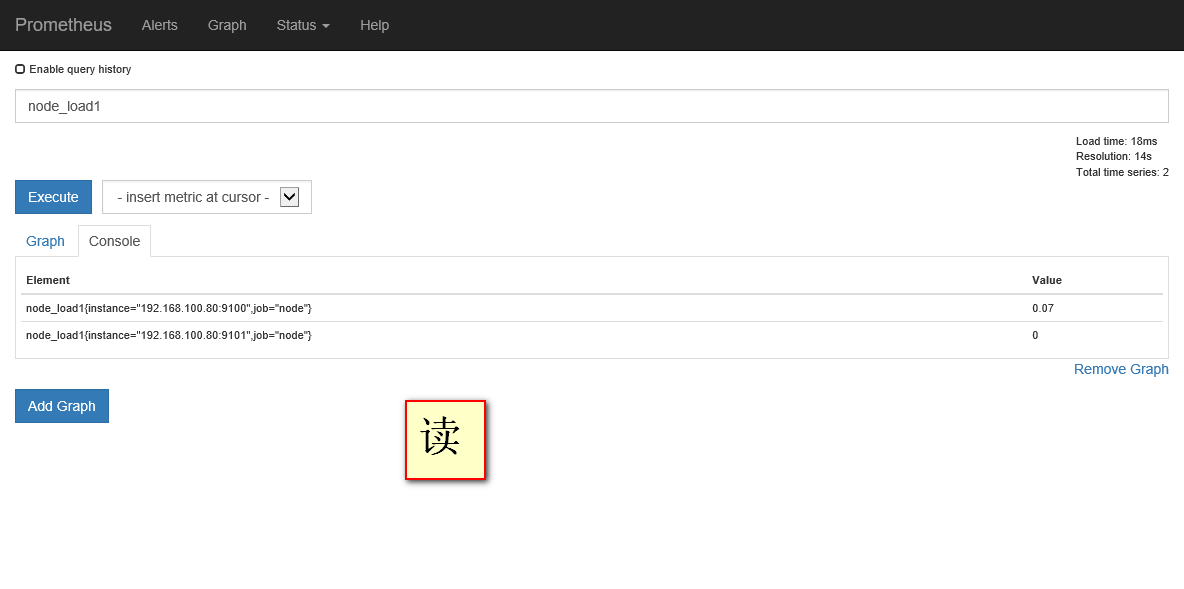
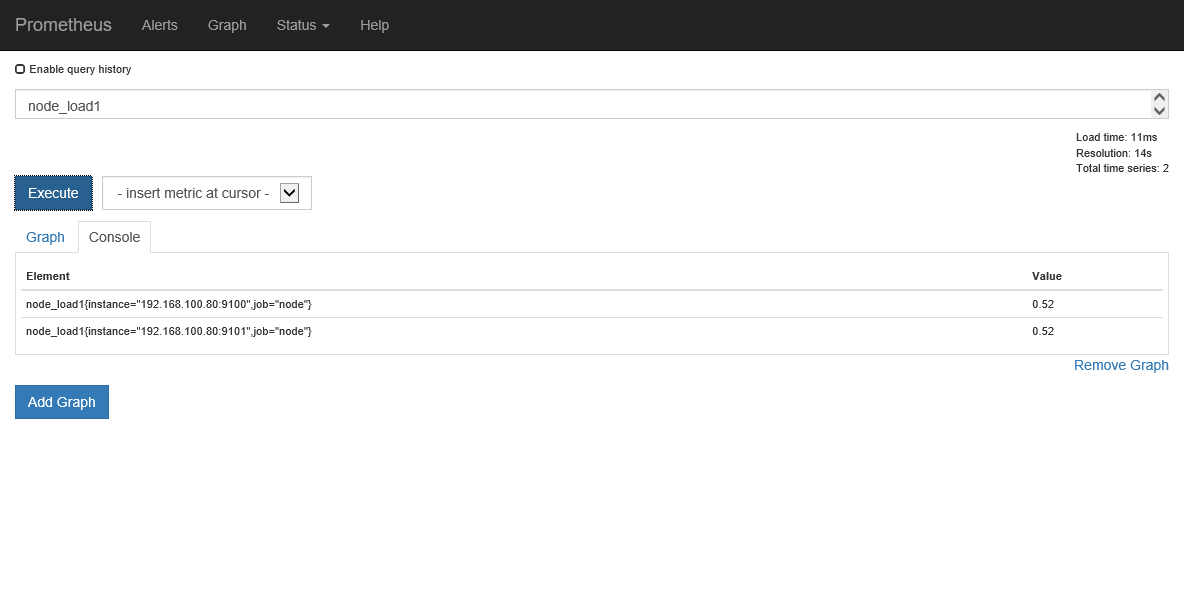
测试效果 访问读所在web页面进行测试
三个web页面将会相同
新建一个node-exporter来验证效果 1 2 3 4 5 docker run -d --name=node-exporter-test --restart=always \ -v "/proc:/host/proc" \ -v "/sys:/host/sys" \ -v "/:/rootfs" \ -p 9101:9100 quay.io/prometheus/node-exporter --path.procfs /host/proc --path.sysfs /host/sys --collector.filesystem.ignored-mount-points "^/(sys|proc|dev|host|etc)($|/)"
然后修改其中一个写的配置文件
1 2 3 4 5 6 7 8 9 10 11 12 13 14 15 16 global: scrape_interval: 15s # Set the scrape interval to every 15 seconds. Default is every 1 minute. evaluation_interval: 15s # Evaluate rules every 15 seconds. The default is every 1 minute. scrape_configs: - job_name: 'prometheus' static_configs: - targets: ['localhost:9090'] - job_name: "sample" static_configs: - targets: ["192.168.100.80:8080"] - job_name: "node" static_configs: - targets: ["192.168.100.80:9100"] - targets: ["192.168.100.80:9101"]
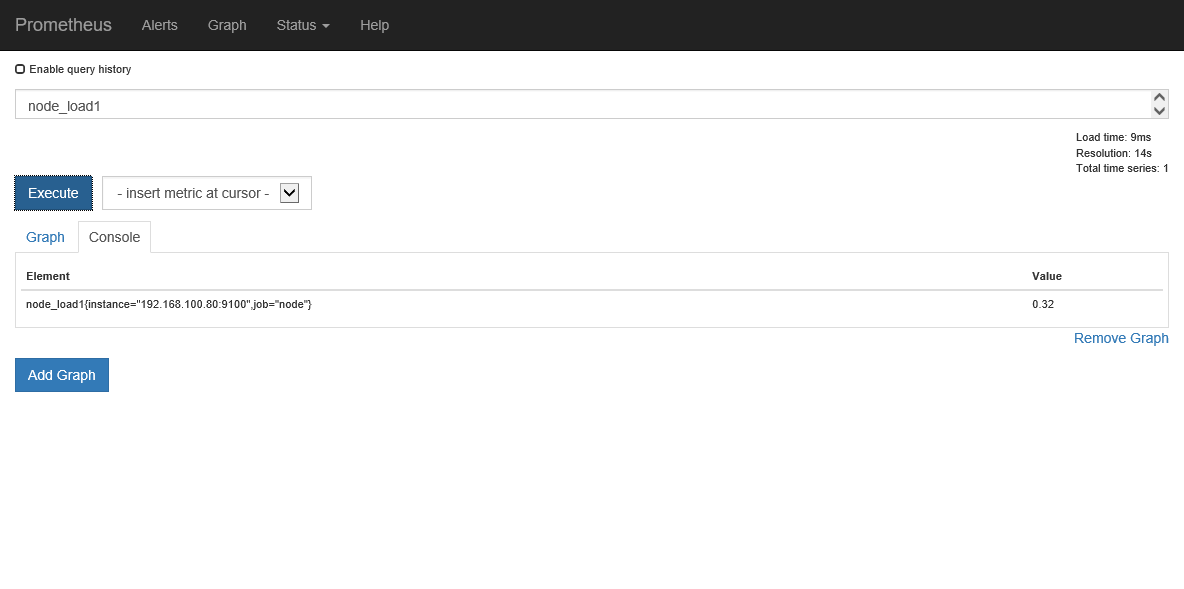
重载服务
1 curl -X POST <http://192.168.100.80:9191/-/reload>
测试效果

 wechat
 alipay